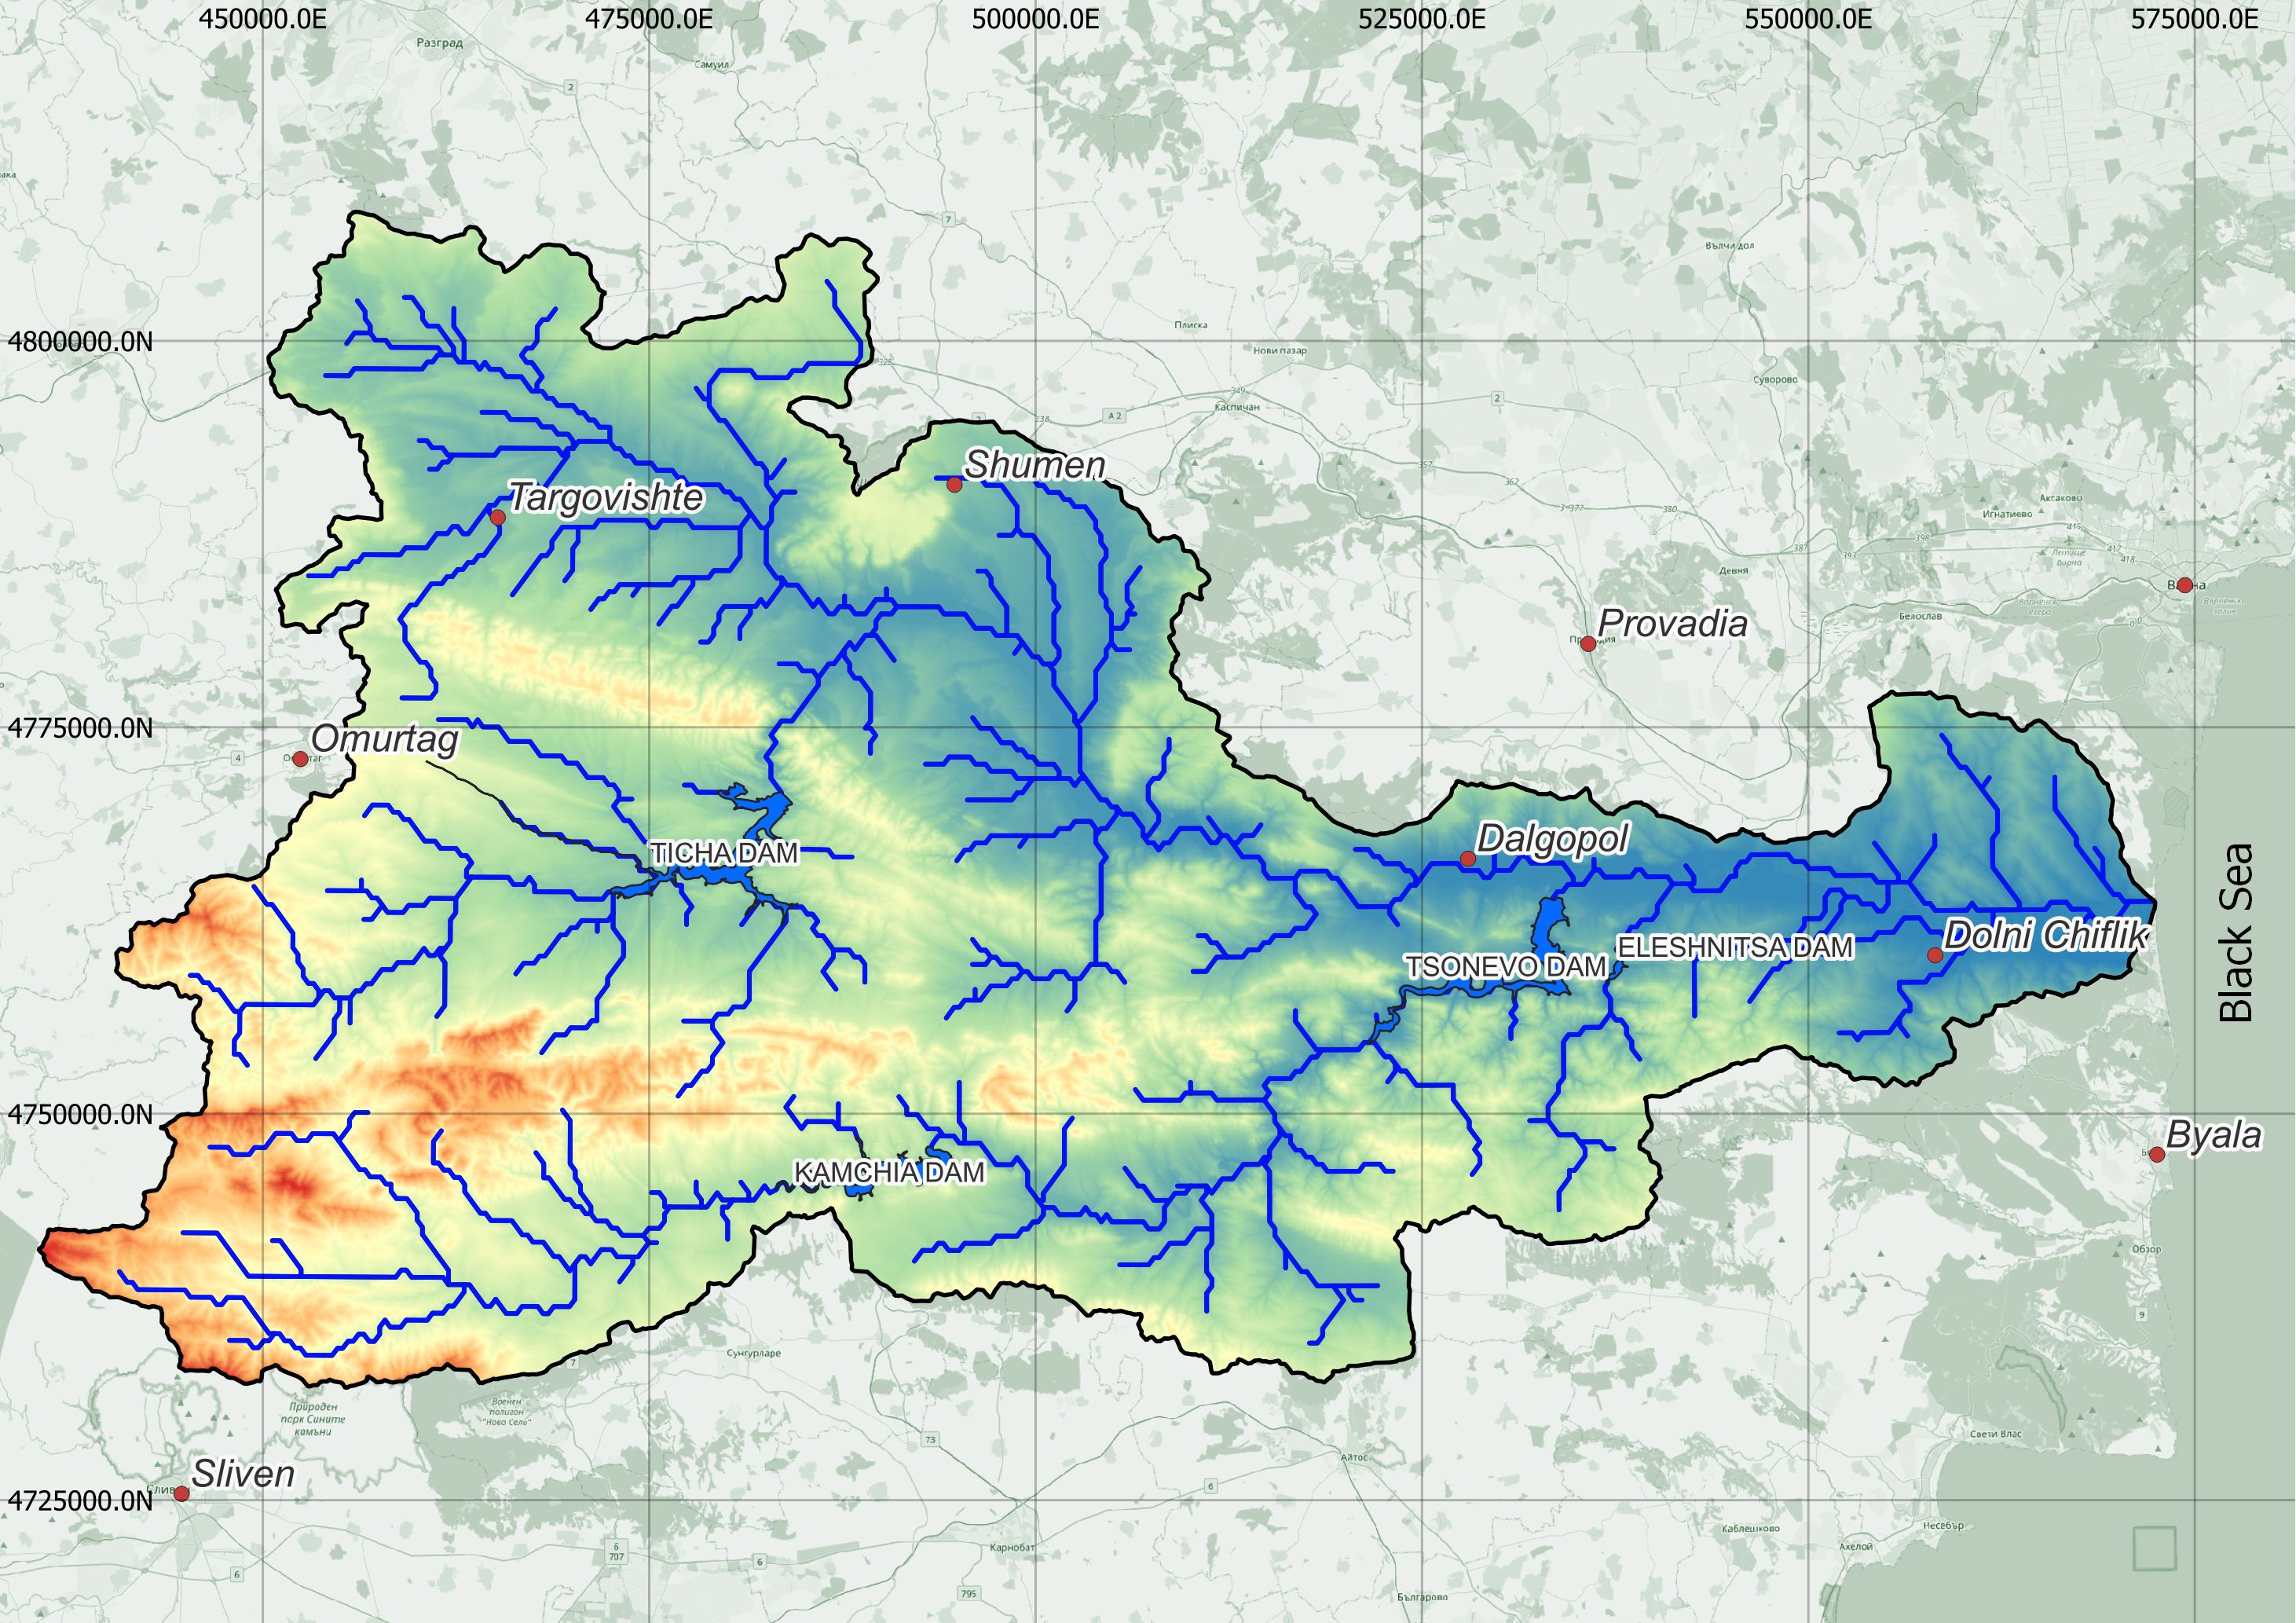
Kamchia is the longest Bulgarian river flowing into the Black Sea, draining almost the entire Eastern Stara Planina and a small part of the Danube Plain. The total length of the river is 244.5 km. Kamchiya River is formed by the confluence of Golyama Kamchiya (left tributary) and Luda Kamchiya (right tributary) rivers at 26 m above sea level, to the southwest corner of the village of Velichkovo, Dulgopol municipality. It flows in an eastern direction in a wide valley between the Avrensko (Momino) plateau in the north and the Kamchiiska mountain in the south. Along its valley runs the border between the Danube Plain and the Pre-Balkans. The estuarine parts of the valley are swampy and overgrown with riparian forests. It flows into the Black Sea at the Kamchia resort complex.
The are of the river basin is 5357,6 km2, as in the northwest and north it borders the river basins of the rivers Rusenski Lom and Provadiyska Reka, in the west - with the basin of the Yantra River, and in the south - with the basins of the rivers Tundzha, Aitoska, Hadjiyska, Dvoinitsa and Fundakliyska, as all except Tundzha flow into the Black Sea. The Kamchia river basin covers parts of 6 administrative regions in Bulgaria - the southern parts of Varna and Shumen regions, the northernmost parts of Burgas region, the eastern part of Targovishte region, the northeastern part of Sliven region and the southernmost parts of Razgrad region.
The analysis of precipitation in the Kamchia river basin is based on the data from
Copernicus Climate Change Service, Climate Data Store (2020)[1]. The data covers the period from 1950 to 2020, presenting the average daily precipitation in [mm/d]. The spatial resolution of the data is 0.1° x 0.1° (approximately 10 x 10 km).
The main goal of the analysis is to identify the changes in the amounts and dynamics of precipitation on the territory of the catchment area. The data has been processed by years, months and days in order to be able to make the most in-depth analysis of the trends in the periods and intensity of precipitation.
The average yearly precipitation in the river basin is 494.84 mm. The wettest year for the period 1950 - 2020г. is 2010 with a total amount of 796 mm for the whole year. The dries year is 2000, when only 293 mm were registered. There is a slight trend in the increase of the average precipitation per year, especially after the 2000s. This corresponds to the changes in the average air temperatures on the territory of the river basin. This is related to the climate change and is expected to continue in the near future.
The month with the highest average monthly amount of precipitation for the considered period is June with an average monthly amount of precipitation of 50.44 mm. The largest amount of precipitation for a given month was recorded in December 2020 - 162 mm. August is the month with the least average monthly rainfall - 29.95 mm. For the considered period, months without any precipitation [0 mm] were recorded - February 1959, October 2010, March 1990. and August 1992 The number of months with rainfall up to 1 mm is more than 10, but for the purpose of developing a machine learning model, these are considered as months with recorded rainfall.
The analysis of precipitation by day shows that the highest amount was recorded on October 1, 2013. - 74 mm. In addition, data by day were statistically processed to estimate rainfall by day of the month and by day of the week. The results show that the day of the month with the largest number of rainy days is May 29th (the accumulated amount of precipitation on this day is 147 mm), and in the month of June, Thursdays are the days of the week with the most amount of precipitation ( > 500 mm for all June's Thursdays). Of course, it can hardly be argued that on May 29, especially if it is a Thursday, it will rain, but nevertheless it makes you consider it a bit more likely.
Probability analysis on the precipitation in the territory of the Kamchia River basin was carried out. The main objective is to determine the rainfall amounts for a day with a particular probability (probability of repetition) of P5%, P1% and P0.1%. Hydrologic processes can be reviewed as random with little or no correlation with similar processes (ie, independent of time and space). Thus, the outcomes of a hydrological process can be treated as stochastic (ie, a non-deterministic process consisting of predictable and random actions). Probabilistic and statistical methods are used to analyze stochastic processes and involve various degrees of uncertainty. The focus of probabilistic and statistical methods is on observations, not on the physical processes itself. A random variable (X) can be described by a probability distribution that specifies the chance that an observed value of "x" will fall within the range of X. For example, if X is the daily rainfall in [mm] at a particular location, then the distribution of X determines the probability that the observed daily rainfall falls within a certain range, such as less than 10 mm, between 10 and 20 mm, 30 – 40 mm, etc.
Three empirical probability curves have been developed, respectively, according to Alekseev, Weibull and Blum. The results are presented in the table below. Daily rainfall with a probability of 1 in 1000 years (P 0.1%) varies between 147 and 162 mm[2].
Probability | Alekseev | Weibul | Blum |
---|---|---|---|
P 5% (1/20 years) | 44 mm | 48 mm | 44 mm |
P 1% (1/1000 years) | 75 mm | 80 mm | 73 mm |
P 0.1% (1/1000 years) | 155 mm | 162 mm | 147 mm |
Machine learning (ML) is a field of research dedicated to understanding and building models (algorithms) that "learn", i.e. methods that use data to improve performance on a specific set of tasks. Machine learning can be seen as part of the work of artificial intelligence.
Machine learning algorithms build a model based on sample data, known as training data, to make predictions and/or make decisions without being specifically designed to do so. Machine learning algorithms are used in a wide variety of applications such as medicine, information technology, speech recognition, agriculture, and many others where it is difficult or infeasible to develop conventional algorithms to perform the required tasks.
The data used to develop the model are - minimum, maximum and average daily air temperature, data on relative air humidity, data on wind speed and direction (at 10 and 100 m height above the earth's surface), solar radiation, geopotential height and atmospheric pressure. The scope of the data is for the period between 2011 - 2020, which allows for optimization and recalibration of the model. The data used to develop the model is freely available at Copernicus Climate Change Service[1].
The model is based on logistic regression (classification model) and is focused on the ability of the model to predict under what parameters (in this case, meteorological conditions) there are precipitation conditions. The model is "trained" from the data for the period 2011 - 2020, and depending on the case, it works with between 75 and 85% of the range. The remaining 15-25% are intended for testing and checking the accuracy of the model and, if necessary, for additional calibration (additional training). It results in classifying the results as 0 and 1, where 0 means "no rain" and 1 means "rain".
From working with the data, it is clear that the most important parameters for the machine model are wind (at a height > 100 m), air humidity and minimum daily air temperature.
The accuracy of the model is represented by the obtained results for the area of the characteristic curve (AUC ROC)[3], the correlation coefficient R2 and the root mean square error (RMSE).
Parameter | Value |
---|---|
AUC ROC | 0.899 |
R2 | 0.843 |
RMSE | 0.395 |
The Confusion Matrix plays a specific role in machine learning and related engineering. It helps to display the prediction and recall in a system where the test data values are known. Typically, a confusion matrix treats a binary classification process. The resulting table is composed of two rows and two columns filled with four values - true positives, false positives, true negatives, and false negatives.
Confusion Matrix | Predicted Positive | Predicted Negative |
---|---|---|
True Positive | 263 | 19 |
True Negative | 47 | 36 |
The confusion matrix results in 263 true positive values (the model predicts precipitation at the set parameters, which corresponds to recorded precipitation for the corresponding day) and 36 true negative values (the model predicts no precipitation, which corresponds to no precipitation for the corresponding day). wrongly predicted values totaled 66 or 18% of the total.
Results from the test set (blue - real data, red - predicted)
The obtained results of the machine learning model can be evaluated as good, but it is important to note that the precise development of such a model requires more data from which the model can be trained. However, this approach allows for a qualitative representation of the dependence of the occurrence of precipitation based on different hydrologic data. Advances in such types of models and artificial intelligence technologies should be seriously considered for their wider application in the field of hydrology and the analysis of huge data sets.
1 - Copernicus Climate Change Service, Climate Data Store, (2020): E-OBS daily gridded meteorological data for Europe from 1950 to present derived from in-situ observations. Copernicus Climate Change Service (C3S) Climate Data Store (CDS). (Accessed on DD-MMM-YYYY), 10.24381/cds.151d3ec6
2 - In June 2014, in the area of the city of Varna, more than 170 mm rainfall fell for several days, and according to some authors, the rainfall on June 19 was more than 120 mm. This leads to a catastrophic flood with casualties and massive damage to the city's infrastructure
3 - Receiver operating characteristic curve (ROC) - a characteristic curve that is used to check the accuracy of the machine model by classifying the true positive and negative predictions in the model against an initially assumed random distribution of the data. (https://en.wikipedia.org/wiki/Receiver_operating_characteristic)
Philip Penchev, PhD
Made in Bulgaria